After spending a some time using sentiment analysis in a professional advisory capacity, I wanted to explore a few personal ideas.
Sentiment analysis is often overlooked as a tool to understand large amounts of unstructured data quickly and determine signals and trends over a time period.
One such idea, was understanding if social data sentiment could be used as a leading indicactor of stock price of small cap companies. My background thinking was that small/micro caps do not have sufficient analyst coverage and minimal trading volumes therefore volume would be driven primarily by retail investors (i.e. not large funds and indexes).
Data Sources
To get started, I needed to find a data source which I can derive a sentiment score from. Hotcopper is pretty well known ‘down under’ as large stock trading forum. It is even publicly listed on the ASX itself!
Twitter was another data source I considered however appeared a little difficult to obtain a sufficient quantity of data easily and with sufficient cleanliness.
Data Collection
I primarily chose to use Ruby due to familiarity. Pairing this with Rails would enable me to spin-up a easy to use front end as well.
To get started, I setup a script using Mechanize and Nokogiri to extract and scrape and parse data by stock.
Initially I focussed on a handful of stocks of interest, those being with sufficient trading history and a reasonable amount of private investor interest (i.e. large number of data points). Some stocks on the ASX appear to have minimal investor interest.
For obtaining financial data, I found Alphavantage an excellent source of ASX market data. I have written about this in more detail here.
Sentiment Analysis
After collecting this data, I next needed to find a way to score each post and assign an overall sentiment with a strength of sentiment. For instance if a post was significantly positive it could have a score of +10, if it was mildly ambivalent it could have a score of +2/-2 and if lightly negative a score of -5 would be assigned.
I would have used the Google NLP API, which I highly recommend and use on some of my other projects including Debtor Insight, however it is very easy to run into some pricing constraints particularly when faced with 100,000+ posts to profile and score.
I found another great library called Sentimental which performs easily identifiable sentiment analysis. You can even use your own dictionary increased precision and quality.
I also used Highcharts for charting and visual analysis. I would readily use another charting system, in particular a tool which allowed multiple y-axis per chart.
Analysis
There are a number of different ways to think about deriving a signal from a post using sentiment. In addition to simply scoring the content of a post with a sentiment score, other ideas included:
Detection of Pump & Dump schemes
I also considered linking stock price performance to individual users to detect if specific users were useful in determining trends (i.e. pump and dump or valid analysis). However I suspect in order to find a strong link, a substantial amout of data would be required in order to determine a trend, in order to capture/group characters over a large period of time and products. I decided at this time it wasn’t worth pursuing at this time.
Sentiment on market announcements
A couple of data providers already provide sentiment analysis/signals based on public announcements. I assumed this wasn’t a sufficiently unique ‘edge’ and doubted that you could react on a signal with sufficient execution speed.
Upvotes to further weight the sentiment of posts
Hotcopper allows users to ‘upvote’ individual posts by users as an indication of quality/interest. These indicators could be used to indicate quality of an individual user and ‘amplify’ the sentiment signal of individual posts.
Finding a suitable market
The next step (which is perhaps where you should start) is to find a broker which offers the ability to go long/short on a wide variety of equity positions on the ASX.
Typical retail brokers tend to incurr reasonable fees at c. $30 AUD/trade. Often some difficulty with liquidity and trade execution at the microcap positions. Typically you can only go long on an equity (not establish a short position). Often no leverage is available which means you are limited by your equity on hand.
The other option is to use CFD providers (i.e. CMC). However CMC provides only a small number of ASX equities (c. 100 (ASX100?)) of which only a portion of them are open to trading. Transaction fees are minimal at c. $7/trade with leverage available.
This is sharp contrast with the likes of the US markets where there appear to be deep markets and ability to trade long/short very easily. This lack of liquidity significantly limited the number of stocks able to be analysed and subsequently traded.
Scoring system - what was useful
Below is an example of how I setup the scoring system.
That's an excellent rundown on the syr agm Mr. Curly. Syrah is actually a "Born Global" firm for anybody who might be interested. Just Google the term and you will see what I mean. They behave and need to be managed in their own unique way which Chairman Askew alerted the shareholders to when he mentioned the difficulties of having a benchmark to determining directors' and senior managements' remuneration. He also mentioned that they had a clear understanding of what sort of board profile was needed to properly manage Syrah and they were working towards it. I believe Syrah is in excellent hands to go forward.
Net sentiment: Positive (+1)
Score: +5.5
From this score we can determine that the post is on balance and is mildly positve with a score of 5.5.
Additional layers of analysis
There were are number of other indicators which needed to be layered onto the actual sentiment analysis in order to determine the strength of a signal.
-
Number of posts. In order to not be swayed by a low volume of posts there needed to be sufficient volume in order to support the signal.
-
Net sentiment vs score. Sometimes sentiment score (numerical) was misleading due to the strength of a particular post which impacts the overall score. For instance - should five mildly positive posts offset a signficantly negative post? I found it useful to look at both net sentiment score and total score in order to confirm both indicators were consistent. In the future it would likely be better to normalise the scores or bucket the scores in smaller groupings (ie mildly positive scores (5-10), highly positive scores (10+)).
Examples of analysis
CLI Q2 2019
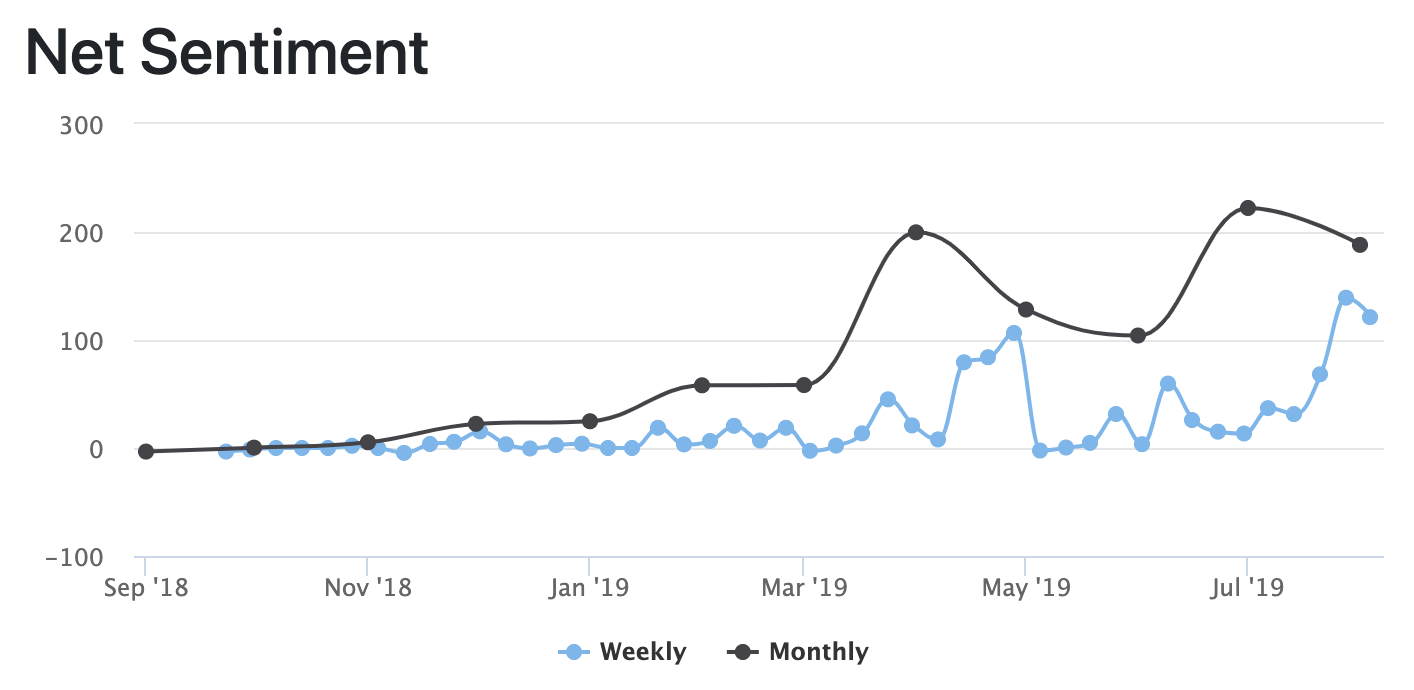
This is an example of Croplogic (CLI:ASX) over the last year.
In this image you can see that the ‘net sentiment’ of posts over the time period had two strong increases both before an increase in stock price.
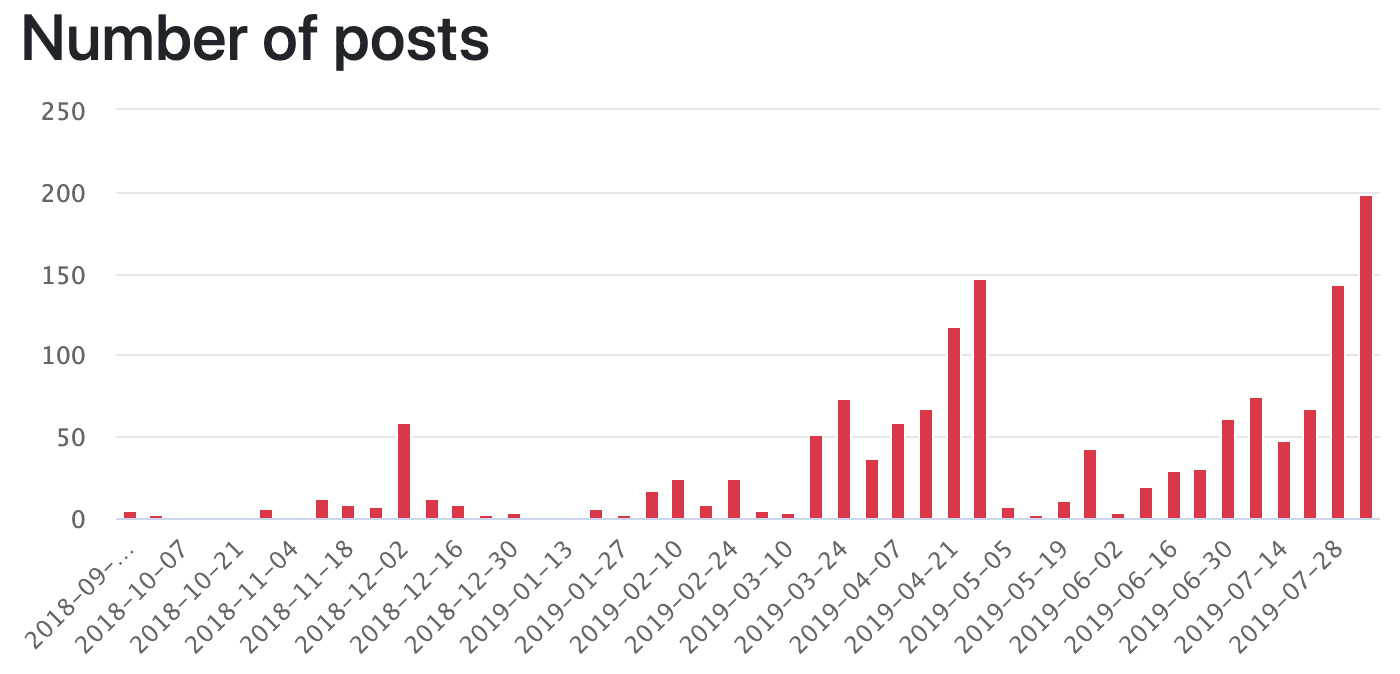
This increase in ‘net sentiment’ could partially be attributed to an increase in the overall volume of posts.
Once you combine the net sentiment with the overall stock price movements (various plots are computed averages to show trends).
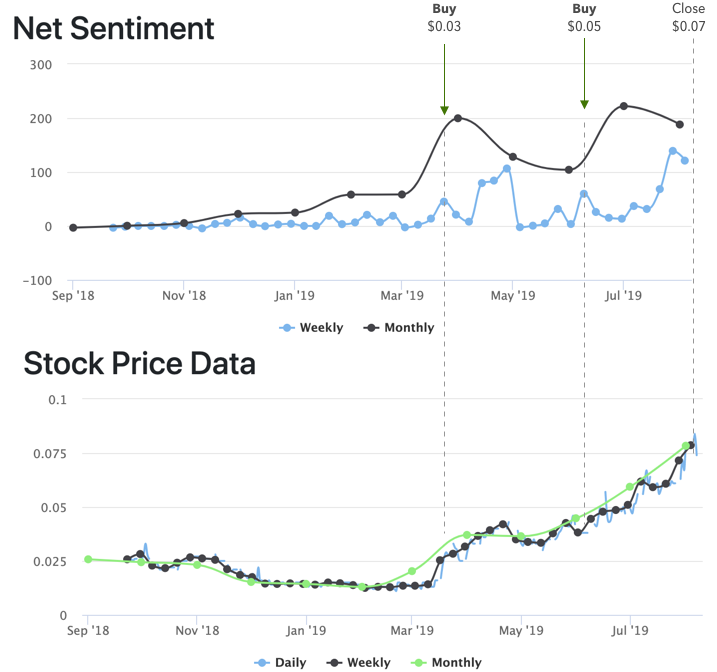
In March 2019 the net sentiment increased c. 300% with the stock price closing at $0.030.
In June 2019 the net sentiment has peaked up an additional 10% with the stock price closing at $0.049.
At the end of July there had been no change in sentiment (i.e. negative trend) with the stock price closed at $0.067.
If you had entered two trades, one at March 2019 and June 2019 following these signals you would be up c. 200% on paper.
Z1P Q2 2019
This is an example of Zip Money (Z1P:ASX) over the last year.
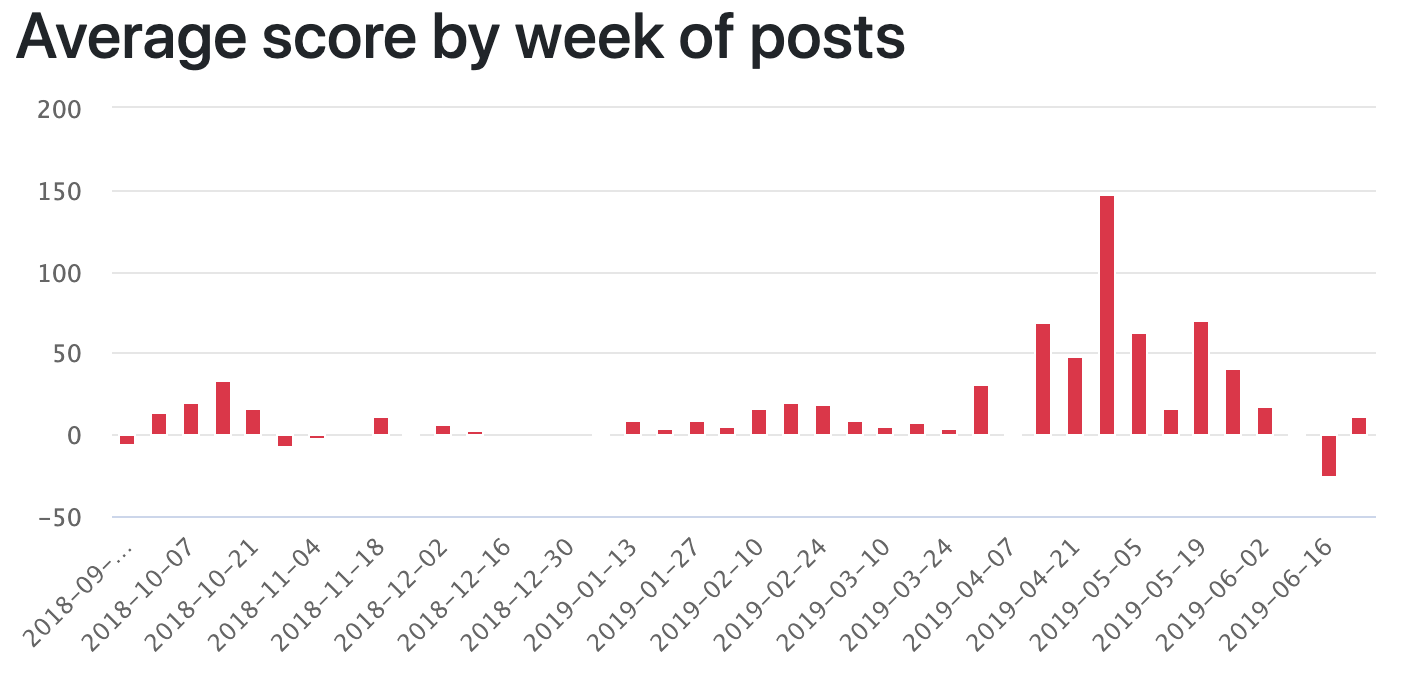
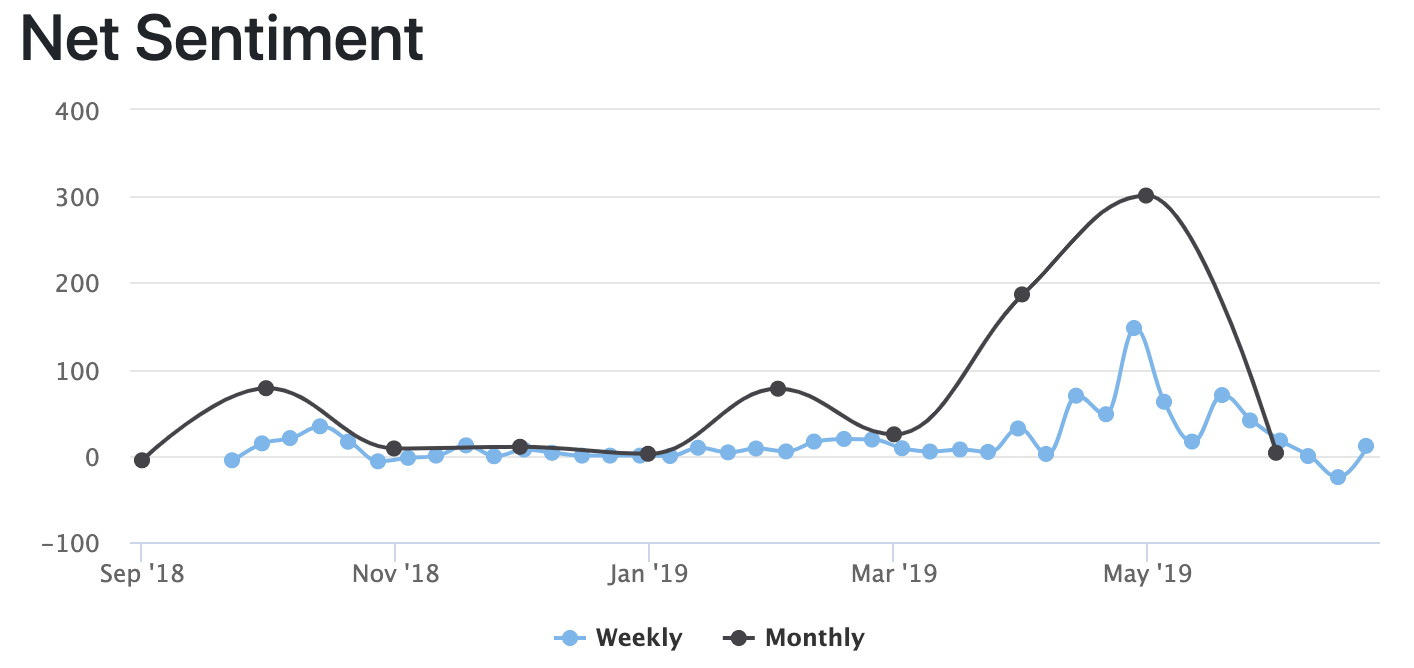
This is less clear however over the last three months there are a few obvious leading signals:
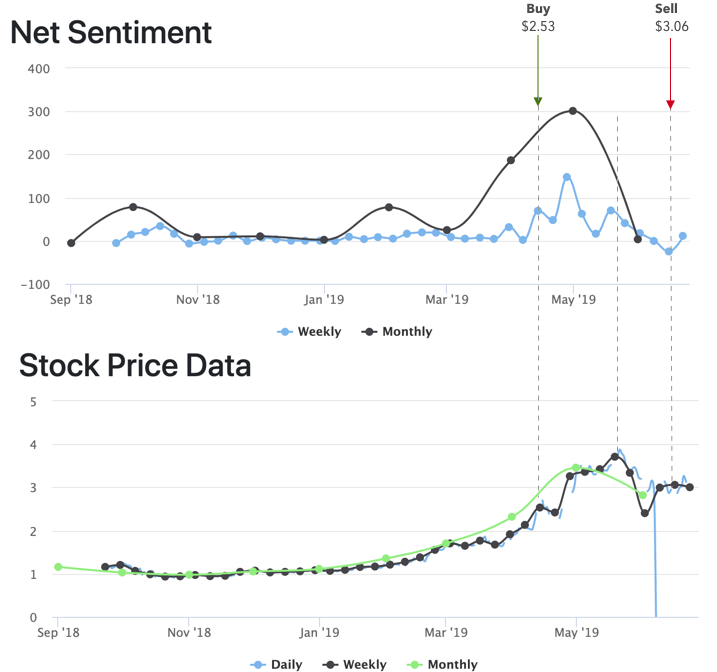
- Net sentiment increase in week of 13 April.
- Net sentiment increase in week of 27 April.
- Negative net sentiment in week of 11 May.
If you were to trade against these signals signals, you could have been up and out of a position realising 20% in little over a month.
Conclusion
So, can you outperform the market using sentiment analysis alone?
Sentiment analysis is no doubt useful to highlight potential opportunities which would otherwise be too time consuming to otherwise filter through. However it was very difficult to find a market to reliably profit from these signals. Retail brokers, such as Interactive Brokers, only offer a small number of stocks to short on the ASX. In order to act on enough of these signals, you need access to a market where you can make a large number of transactions on either side of the market (i.e. long and short).
If I was to redo this exercise, I’d focus on finding a market first (i.e. USA?), then go about finding a relevant data source and then completing analysis around the available products.
These signals are useful to guide and identify potential opportunities to consider. Layering on some solid diligence on these opportunities would further improve your odds of success.